Note
Go to the end to download the full example code.
Indirect Detection Tutorial#
Compute indirect detection signals and limits from dark matter annihilation.
Dark Matter Annihilation into Photons#
Indirect detection looks for products of dark matter annihilation in astrophysical environment where the dark matter is denser. For instance, typical benchmarks for gamma-ray searches are the dSphs or the Galactic Center.
In this example, we study the process χ χ → SM SM using a DM simplified model which annihilates trough a vector mediator. We will see how compute the resulting gamma-ray spectra relevant for indirect detection using both Pythia 8 and CosmiXs.
First, import the model and define the dark matter candidate. We use the DMsimp_s_spin1_MD model,
selecting a fermionic dark matter ~xd:
MadDM> import model DMsimp_s_spin1_MD
MadDM> define darkmatter ~xd
Then, we generate the indirect detection process. This defines the channel for which the gamma-ray spectra will be computed.
We then output the process to a folder named ID_spin1, and we launch the process.
MadDM> generate indirect_detection
MadDM> output ID_spin1
MadDM> launch ID_spin1
We enable the computation of the gamma-ray flux spectrum by setting:
MadDM> set indirect = flux_source
We can choose to compute the gamma-ray spectra using either Pythia 8 or CosmiXs, entering pythia8 or CosmiXs respectively:
MadDM> set indirect_flux_source_method CosmiXs
To save the full energy spectra you can set:
MadDM> set save_output spectra
You can enable the precise mode for a full integration over the DM velocity distribution. For a faster evaluation
you can use the fast mode, where the thermally averaged annihilation cross section is computed at a fixed velocity.
MadDM> set fast
In precise mode, you can choose between madevent and reshuffling methods of the event generator
MadEvent. This is not needed in fast mode.
MadDM> set sigmav_method madevent
In precise mode, to specify how many events should be generated per phase-space point, do:
MadDM> set nevents 100000
and finally launch the process pressing Enter. You will see the following output:
INFO: MadDM Results
INFO:
****** Indirect detection:
INFO: <sigma v> method: inclusive
INFO: ====== continuum spectrum final states
INFO: DM particle halo velocity: 2e-05 c
INFO: *** Print <sigma v> [cm^3 s^-1] with Fermi dSph limits
INFO: xxdxxdb_ddx         All DM = 3.48e-29       ALLOWED           Fermi dSph ul    = 3.30e-27
INFO: xxdxxdb_uux         All DM = 3.48e-29       ALLOWED           Fermi dSph ul    = 3.31e-27
INFO: xxdxxdb_ssx         All DM = 3.48e-29       ALLOWED           Fermi dSph ul    = 3.30e-27
INFO: xxdxxdb_ccx         All DM = 3.48e-29       ALLOWED           Fermi dSph ul    = 4.54e-27
INFO: xxdxxdb_bbx         All DM = 3.41e-29       ALLOWED           Fermi dSph ul    = 5.98e-27
INFO: Skipping zero cross section processes for: xxdxxdb_y1y1, xxdxxdb_ttx, xxdxxdb_emep
INFO: Using generic Fermi dSph limits for light quarks (u,d,s)
INFO: DM DM > SM SM       All DM = 1.73e-28       ALLOWED           Fermi dSph ul    = 2.96e-27
INFO:
INFO: *** Fluxes at earth [particle cm^-2 sr^-1]:
INFO: gammas Flux         = 5.67e-12
INFO: neutrinos_e Flux    = 2.71e-12
INFO: neutrinos_mu Flux   = 5.00e-12
INFO: neutrinos_tau Flux  = 4.26e-15
INFO:
INFO:
INFO: Results written in: /Users/yourname/yourprocessfolder/ID_spin1/output/run_01/MadDM_results.txt
Plot the Gamma-ray Spectra#
After running the above commands, you will find the output in the ID_spin1 folder.
The output will contain the gamma-ray spectra in the ID_spin1/Output/xxxx folder.
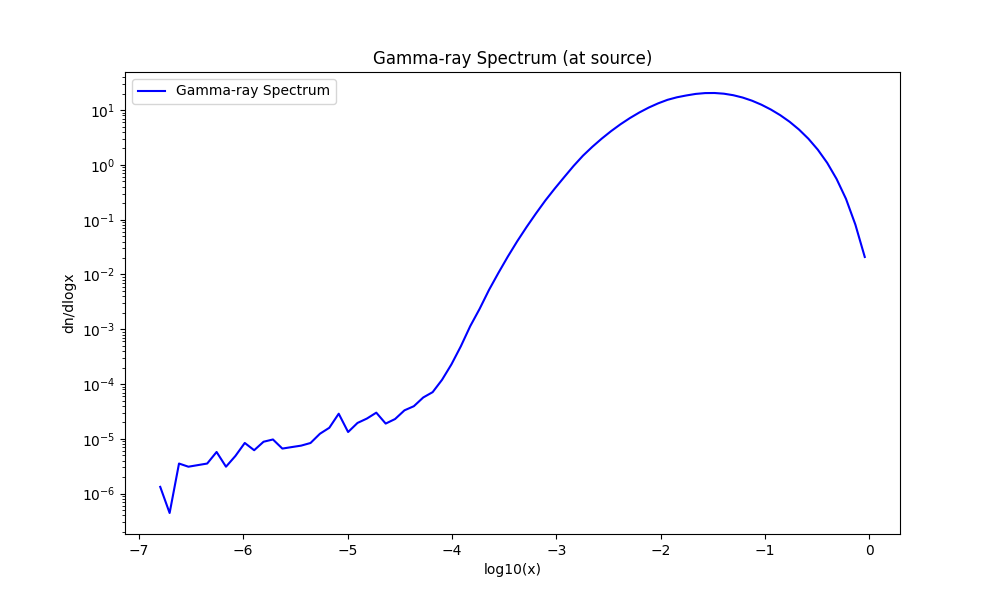
Here’s the gamma-ray spectra computed by MadDM using CosmiXs:
import matplotlib.pyplot as plt
import numpy as np

def plot_gamma_spectra(spectra_file):
    """
    Plots dn/dlogx vs log10(x) from the spectra file.

    Parameters:
    spectra_file (str): Path to the spectra file.
    """
    logx_vals = []
    dndlogx_vals = []

    # Read the data file
    with open(spectra_file, 'r') as file:
        for line in file:
            if line.startswith('#'):
                continue  # skip header lines
            parts = line.strip().split()
            if len(parts) != 2:
                continue  # skip malformed lines
            logx, dndlogx = map(float, parts)
            if dndlogx == 0:
                continue  # skip zero rates
            logx_vals.append(logx)
            dndlogx_vals.append(dndlogx)

    logx_vals = np.array(logx_vals)
    dndlogx_vals = np.array(dndlogx_vals)

    # Plot the spectra
    plt.figure(figsize=(10, 6))
    plt.plot(logx_vals, dndlogx_vals, label='Gamma-ray Spectrum', color='blue')
    plt.xlabel('log10(x)')
    plt.ylabel('dn/dlogx')
    plt.title('Gamma-ray Spectrum (at source)')
    plt.yscale('log')  # set y-axis to log scale
    plt.legend()
    plt.show()

plot_gamma_spectra('./plot_data/gammas_spectrum_CosmiXs.dat')
Exiting MadDM#
MadDM> quit
Total running time of the script: (0 minutes 0.273 seconds)